Silt Fence Detection System
Computer vision pipeline for automating erosion-control inspection on construction sites.
Overview
Construction sites are required to install and maintain silt fences to control erosion and sediment runoff. Compliance inspections happen manually today - an inspector walks the site, documents damaged or failing fences, and writes a report. It is slow, the quality depends on who is walking, and for a large site the reporting stage takes longer than the walking stage.
Edge Drone Services already captures aerial imagery of these sites with drones. The idea was to use that imagery to replace the manual inspection loop with an AI system: detect the fences from drone footage, classify which ones are damaged, score them by severity, and output a prioritized report. I was the solo AI/ML intern on the project and built the pipeline end-to-end over the summer.
What I Built
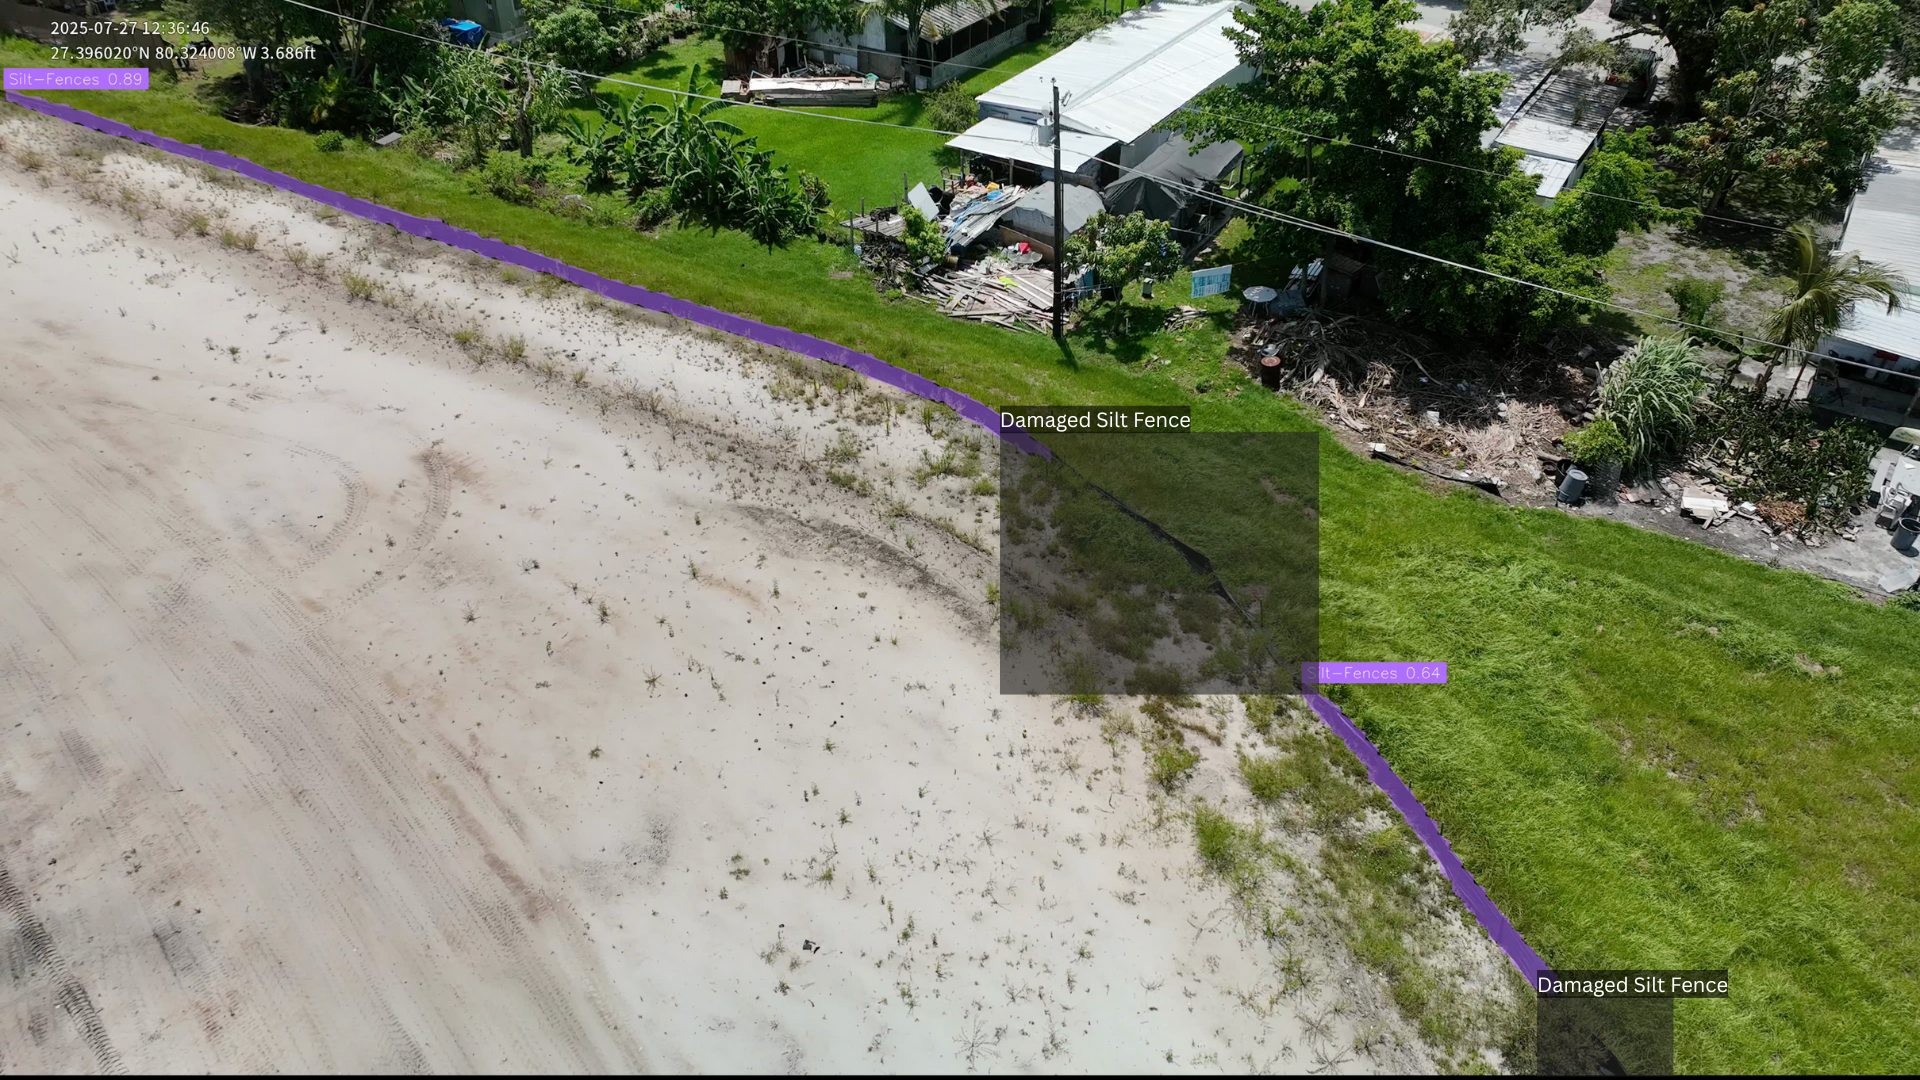
A computer vision system that takes drone imagery and returns silt fence detections with damage classification. The detection model is trained, deployed, and running inference on real site imagery through Roboflow. Around that core model I built the dataset engineering pipeline that feeds it, a damage-classification architecture, a severity scoring system for reports, and a separate drone distance-estimation module that can map detections to real-world coordinates.
Not everything shipped to production. The fence detection model is live. The damage classifier, severity scoring logic, and distance-estimation module are built but were not fully wired together into a single closed-loop reporting system by the end of the internship.
Architecture
I went with a two-stage approach rather than a single model.
Stage one detects silt fences in an image using instance segmentation - pixel-level masks rather than bounding boxes. Silt fences are long, thin, irregular objects that weave through vegetation and terrain, so a box around one captures mostly background. Masks give the actual fence shape, which matters downstream when you want to measure how much of a fence is damaged.
Stage two takes those fence detections and classifies condition: intact versus damaged. Splitting the problem this way means the "where is the fence" model and the "what condition is it in" model can be trained, debugged, and improved independently. A single model trying to learn both at once would be harder to diagnose when it fails.
Dataset Engineering
This was the largest part of the work, and the part that took the most iteration.
The starting dataset was around 90 images pulled from existing drone captures. Far too small to train a segmentation model on. Labeling was done in COCO format with polygon masks instead of bounding boxes, because the downstream model needed pixel-level geometry.
Raw collection scaled the dataset to roughly 1,000 intact-fence images. Damaged fence images were the bottleneck - only about 23 were available from real site captures, since damaged fences are rarer than intact ones and harder to find in existing footage. That class imbalance meant a single combined model would just learn to predict "intact" every time.
The solution was augmentation. I built an augmentation pipeline using Albumentations that applied rotation, scaling, lighting shifts, and perspective transforms to expand the usable dataset. After augmentation, the intact-fence training set grew to around 4,500 images, and by final training had been expanded further to around 20,000. The damaged-fence class was trained as a separate model on roughly 2,500 augmented images, which sidestepped the imbalance problem by letting each model specialize.
Problems that ate real time during this phase:
- Mask alignment under augmentation. Applying a rotation to an image is easy. Applying the same rotation to a polygon mask so the fence outline still traces the fence is where things break. Had to sort out the transform pipeline so mask geometry stayed consistent.
- JSON file size. COCO annotation files balloon fast with thousands of images and complex polygons. A naive run pushed the train.json from kilobytes to multiple gigabytes. Had to tune polygon simplification - how many points define each mask - to keep file size manageable without destroying shape accuracy.
- Directory and file structure consistency. COCO expects strict relationships between the JSON and the image directory. Small mismatches break training with errors that don't point at the actual cause.
Training and Results
Training ran on Roboflow's hosted pipeline. The final detection model was trained on approximately 20,000 images of intact fences and evaluated on a held-out set.
The confusion matrix from the final run:
- 148 correct damaged-fence predictions
- 28 false positives
- 57 false negatives
- Total error rate of roughly 3.5% across the evaluation set
The F1 vector analysis showed a few isolated hard cases - dark red dots scattered through the embedding space - but no large clusters indicating a systemic blind spot. If a cluster had shown up, that would have told me exactly which kinds of images to collect more of. Clean-looking vector analysis meant the training data coverage was reasonable.
I did not report finalized mAP or precision/recall metrics. The focus during the internship was on getting training stable, raising dataset quality, and verifying qualitative performance on real drone footage rather than locking numbers for a formal benchmark. The system was still in active iteration.
Damage Classification and Severity Scoring
Detection alone is not a report. An inspection output needs to prioritize - what needs attention first, what can wait. I designed a severity scoring scale from 1 to 5, where 1 is minor (loose tautness, small tears) and 5 is severe (full washouts, collapsed fence). Detections get sorted by severity so the top of the report is what actually matters. The scoring categories were refined through feedback from domain-expert inspectors on what kinds of damage they prioritize on a real walk-through.
Each flagged issue in the output includes: location, severity score, image evidence, and category of damage.
Distance Estimation
Separate from the detection pipeline, I built a Python module that uses drone telemetry - GPS position, camera tilt angle, altitude - to estimate real-world distance from the drone to a detected object in the frame. The math is straightforward camera geometry, but the integration problem is where telemetry syncs with captured frames.
The goal was to take a detection in pixel space and map it to a GPS coordinate on the ground, so a report could say "damaged fence at this latitude/longitude" instead of "damaged fence somewhere in frame 247." This module exists as a working standalone system. Wiring it into the detection pipeline as a single flow was on the roadmap but not finished by the end of August.
What Shipped vs What Was Designed
Shipped and running:
- Silt fence detection model, trained and deployed on Roboflow, running inference on real site imagery
- Dataset pipeline with augmentation and COCO export
- Distance-estimation module as a standalone tool
Built but not integrated:
- Damage classifier as a second-stage model
- Severity scoring and report-sorting logic
- End-to-end glue between detection, classification, distance estimation, and report output
Lessons
The model was not the hard part. The hard part was the data - collecting damaged-fence imagery, labeling it at pixel accuracy, keeping annotations consistent under augmentation, managing file-size blowup. Training ran in hours; dataset work ran all summer.
The second lesson was scoping. A closed-loop inspection system - drone captures, model detects, telemetry locates, report generates, severity sorts - is a bigger system than one intern can finish in 14 weeks. Getting the detection stage into real deployment, with a real dataset and real metrics on real drone footage, was more valuable than half-building every layer.